RondoTrace
See thesupply chainyou don't own.
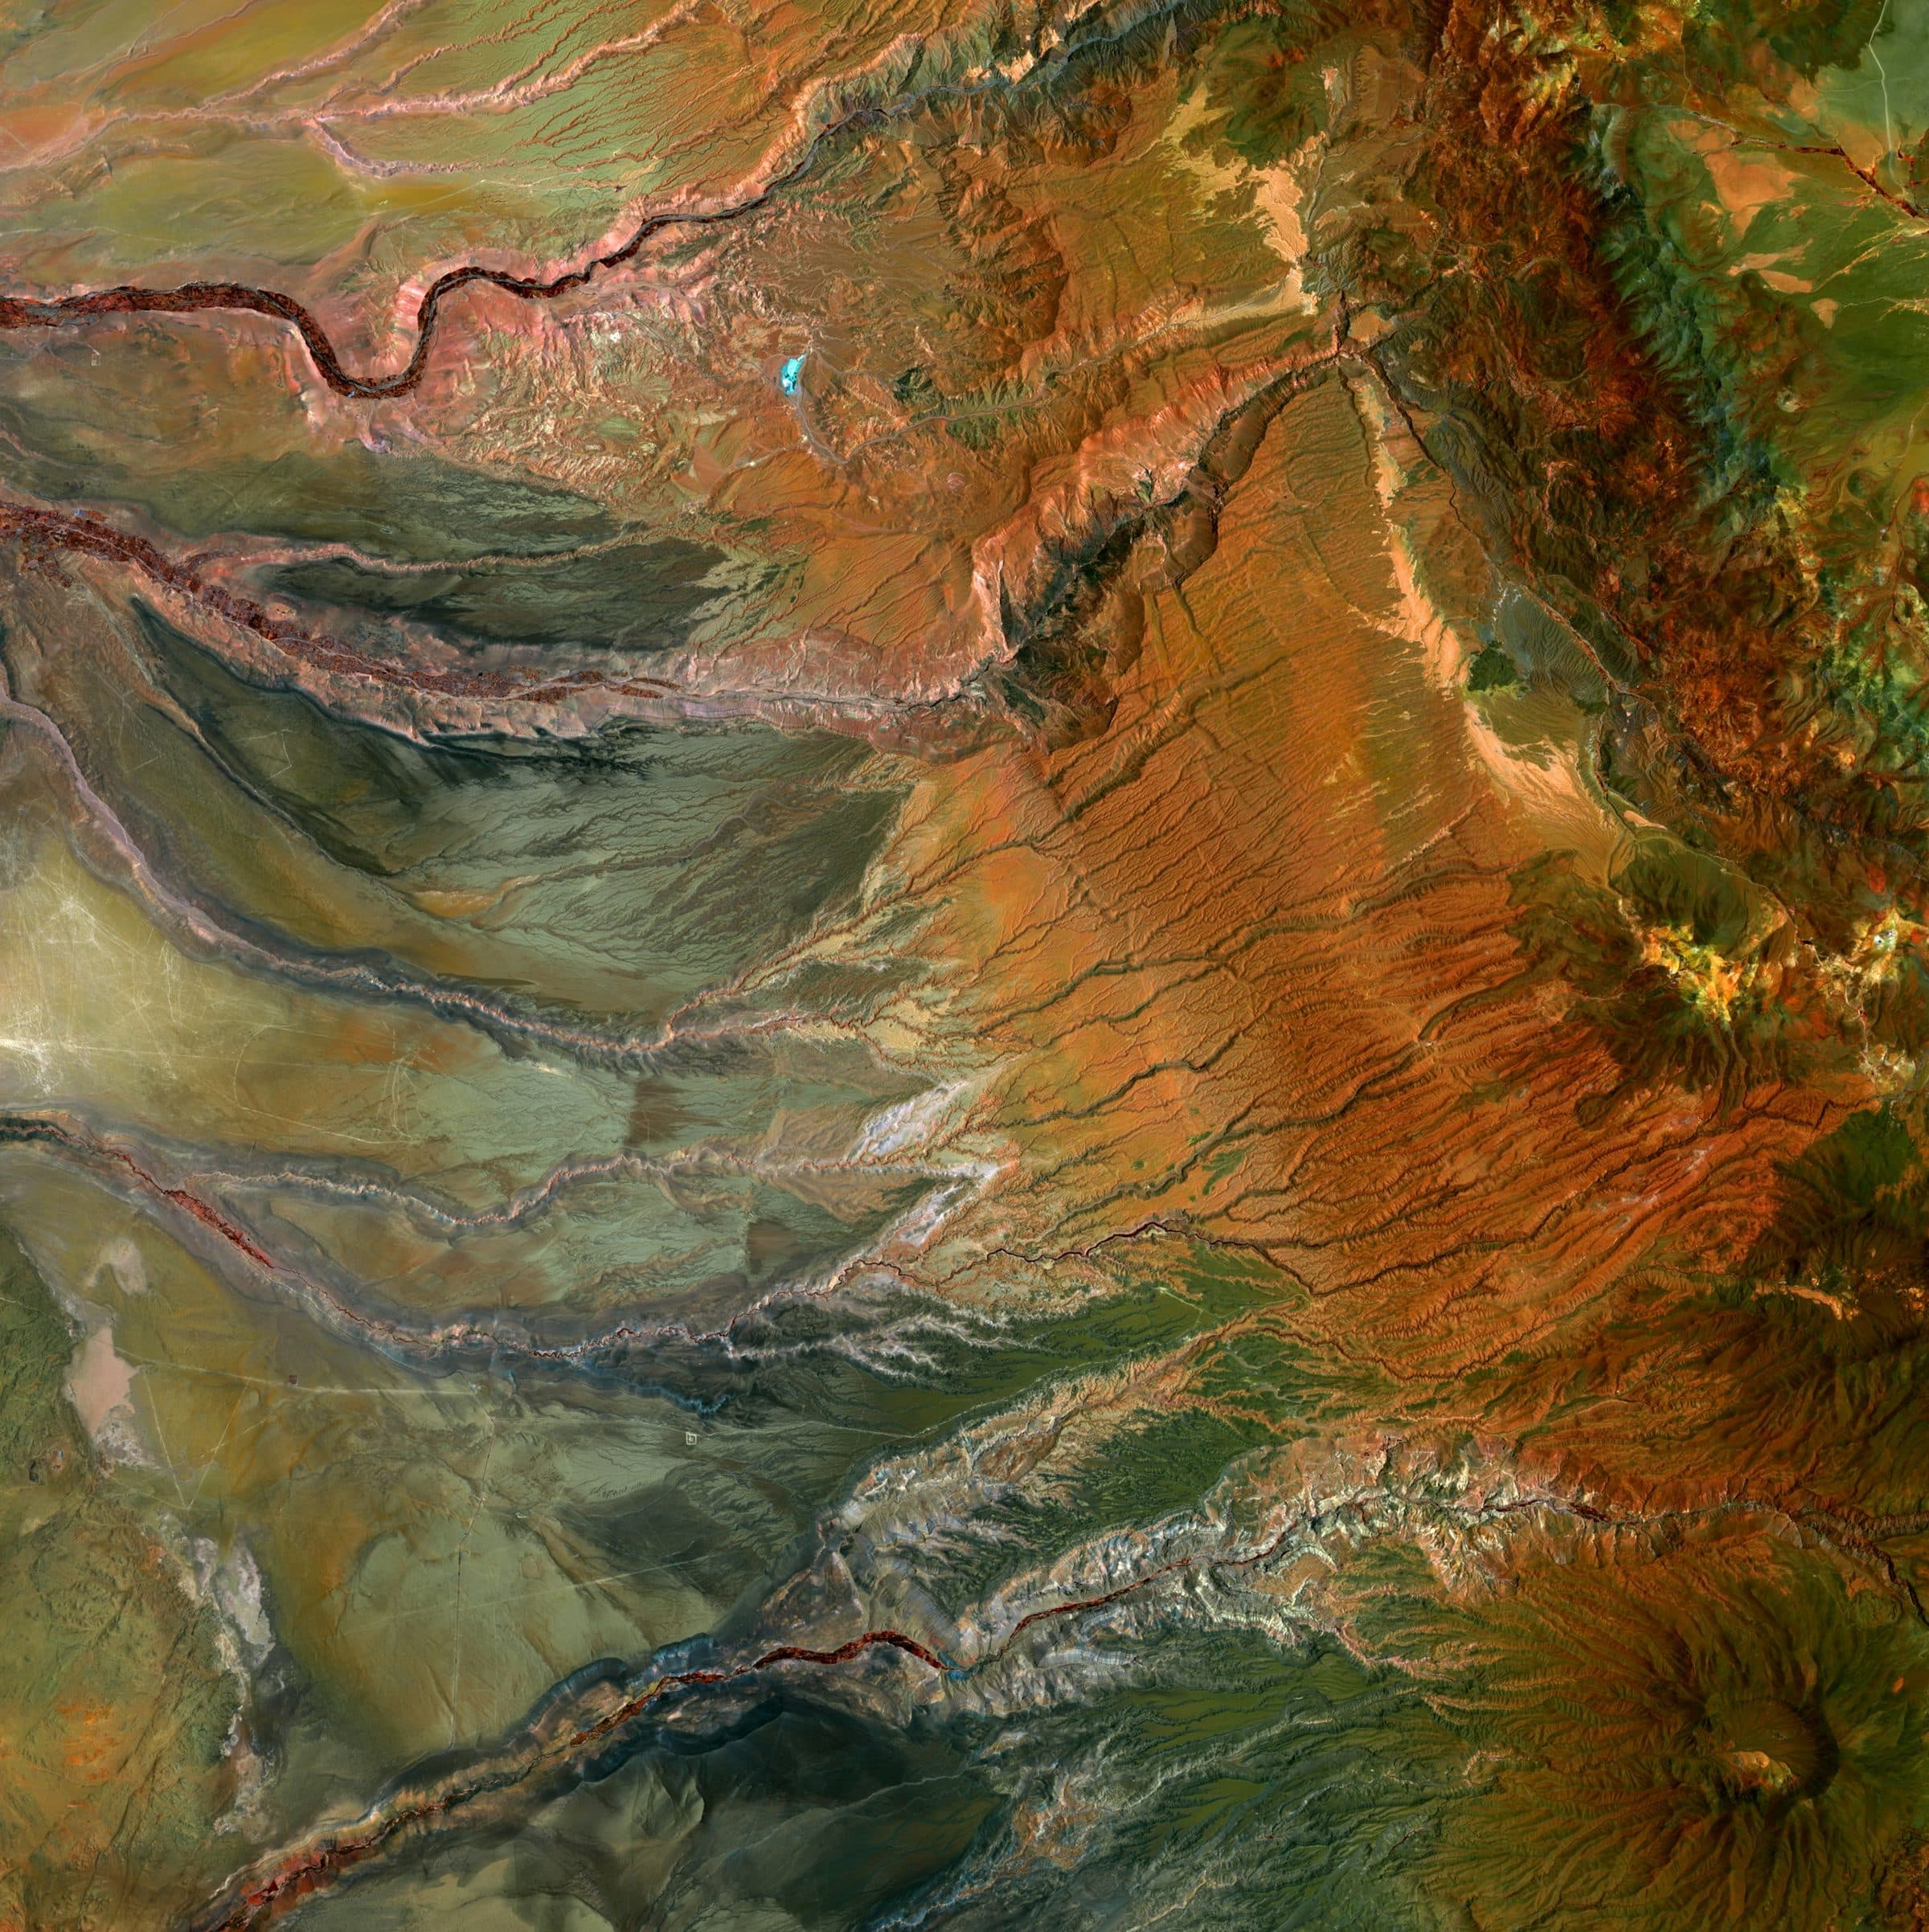
RondoTrace maps the suppliers behind your suppliers and watches their sites continuously, from space and from public sources, so you see disruption forming before it reaches your line.
Most disruptions start where you have no visibility.
You know your tier-1 suppliers. You have their contracts, their certificates and their questionnaire answers.
The flood, the fire, the dam, the strike or the shutdown usually happens further back: at a smelter, a refinery or a mine that supplies your supplier's supplier.
By the time you hear about it, it is either in the news or in your shortage report.
Your systems see the inside of your supply chain. We show you the outside.
Planning systems and decision tools work on the data you already own: orders, inventory, lead times, your tier-1 network. They are getting very good.
What they cannot give you is the part you don't own: which companies actually sit behind your suppliers, what is happening at their sites, and what is being said about them in languages and places your team never reads.
That is what RondoTrace builds, and it works alongside the systems you already have.
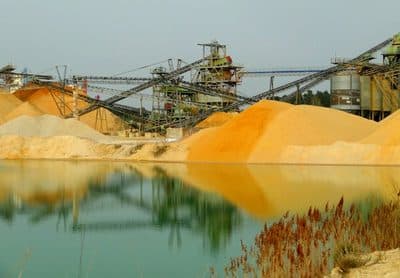
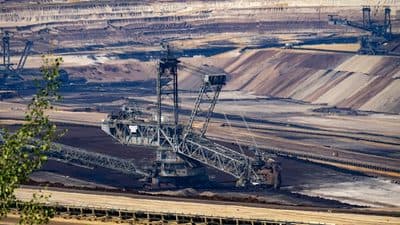
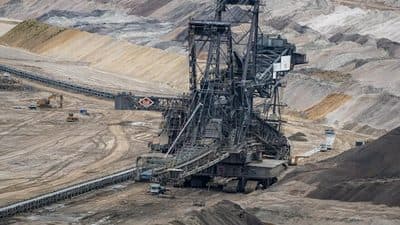
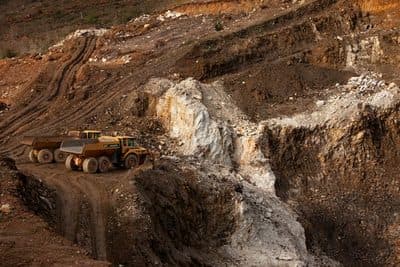
Who actually supplies your suppliers.
We resolve your supply chain several tiers deep, to named companies and physical sites, using corporate filings, trade and customs records, facility registries and material flows. Every link carries a confidence level, so you know what is confirmed and what is inferred.
MORE ON THE PLATFORM →What is happening at those sites, continuously.
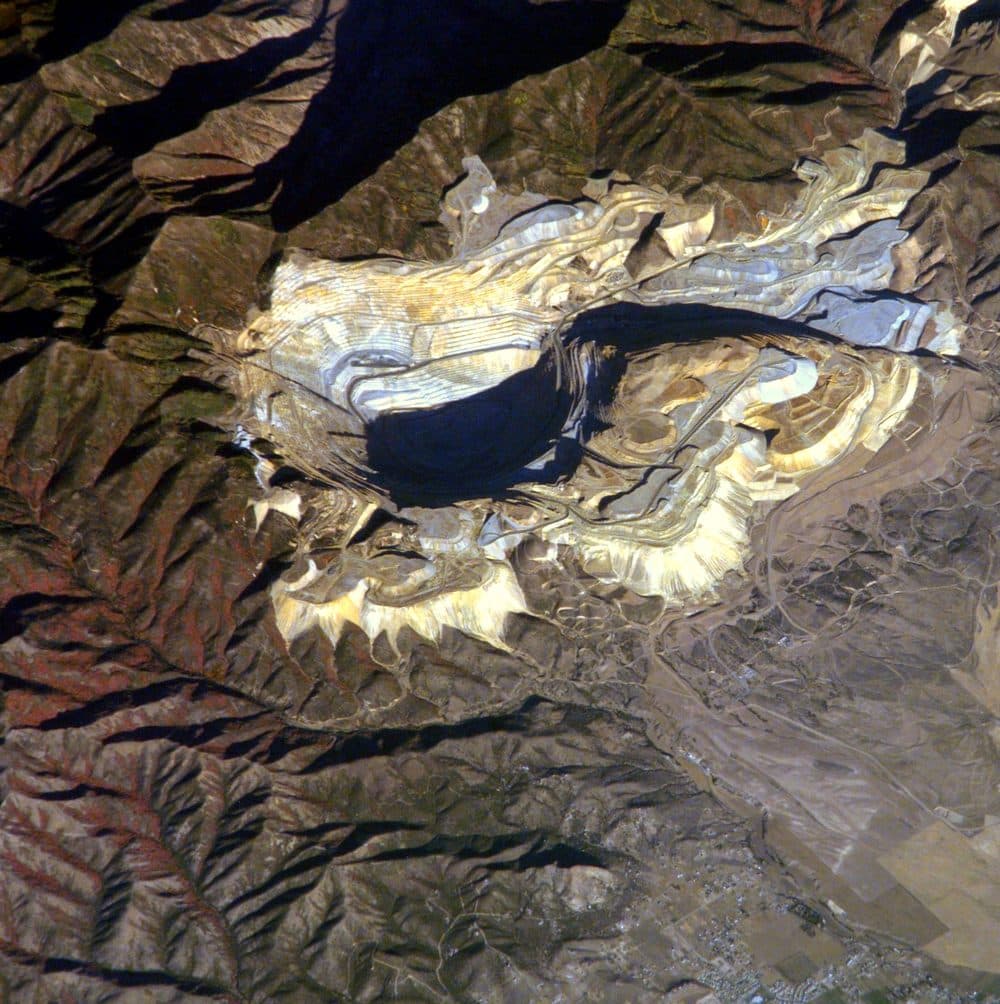
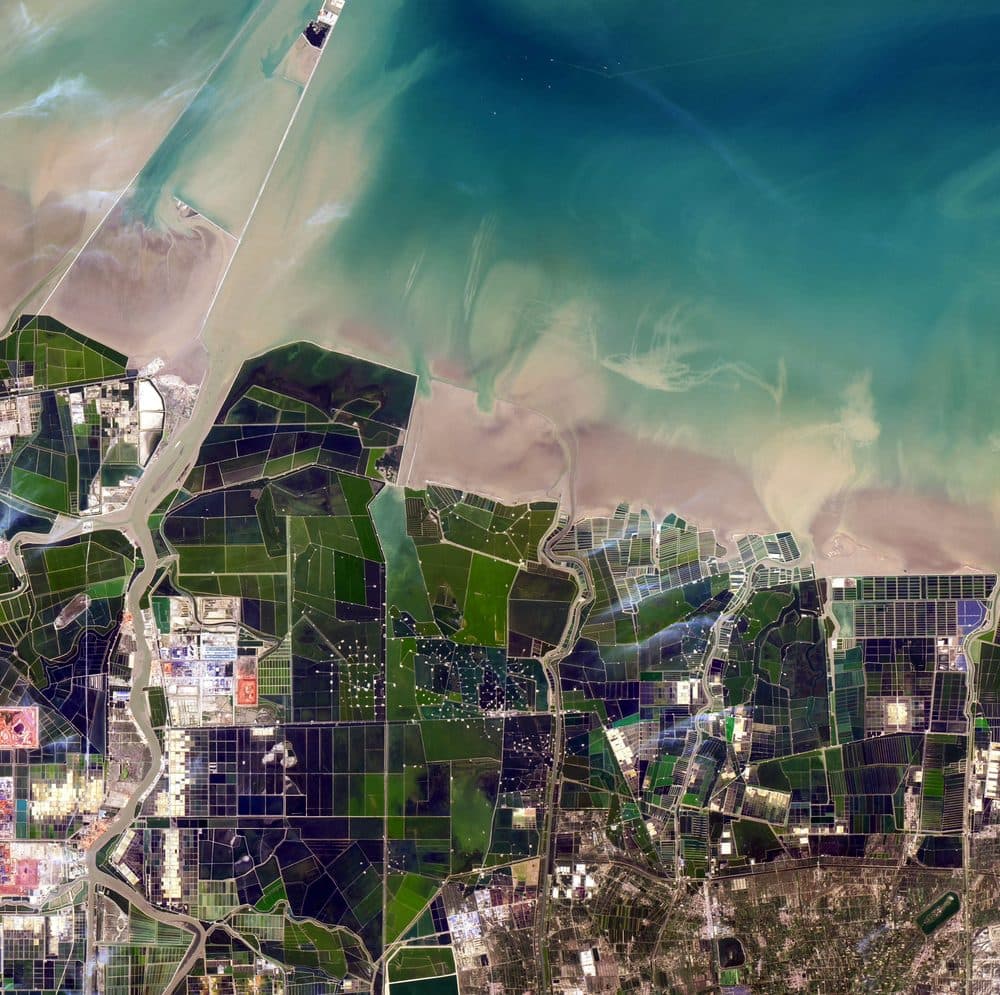
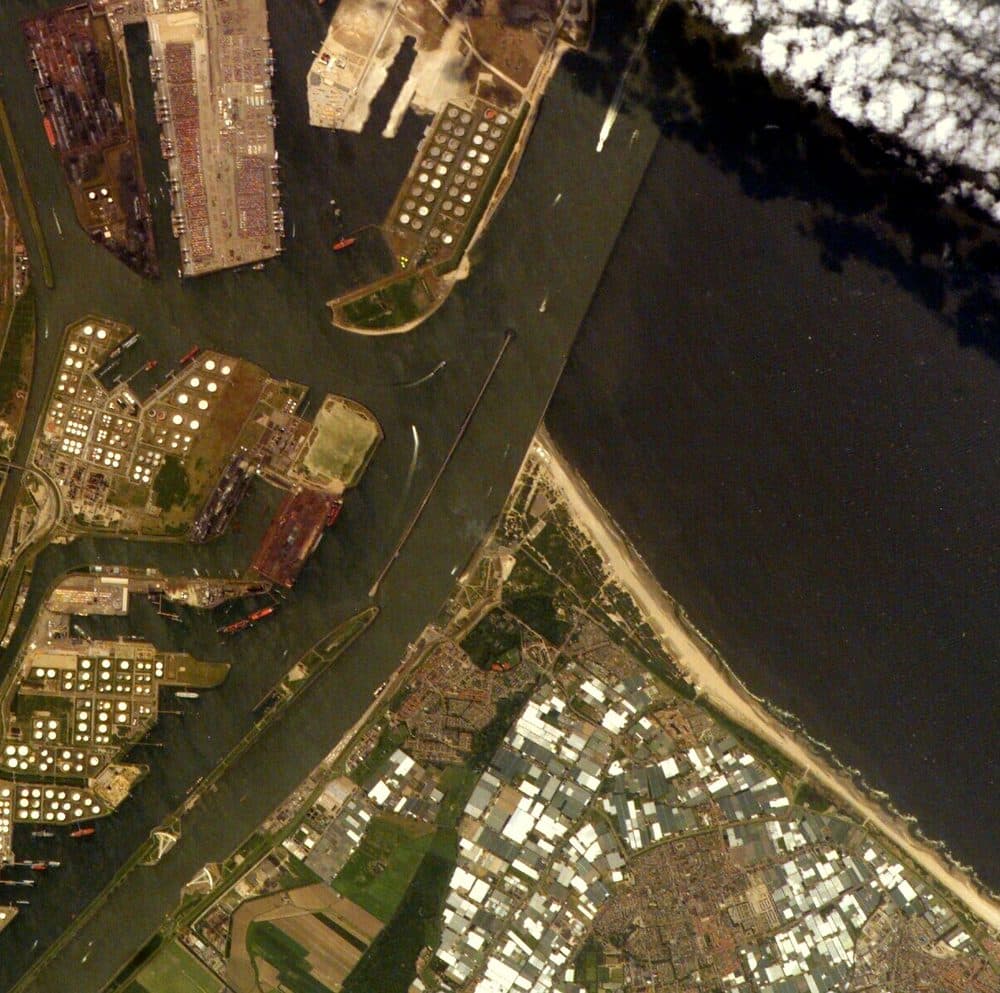
We observe each site from space and from public sources: ground movement, heat, emissions, water, land and forest change, and signs of activity or its absence. Nothing depends on the supplier telling us.
MORE ON THE PLATFORM →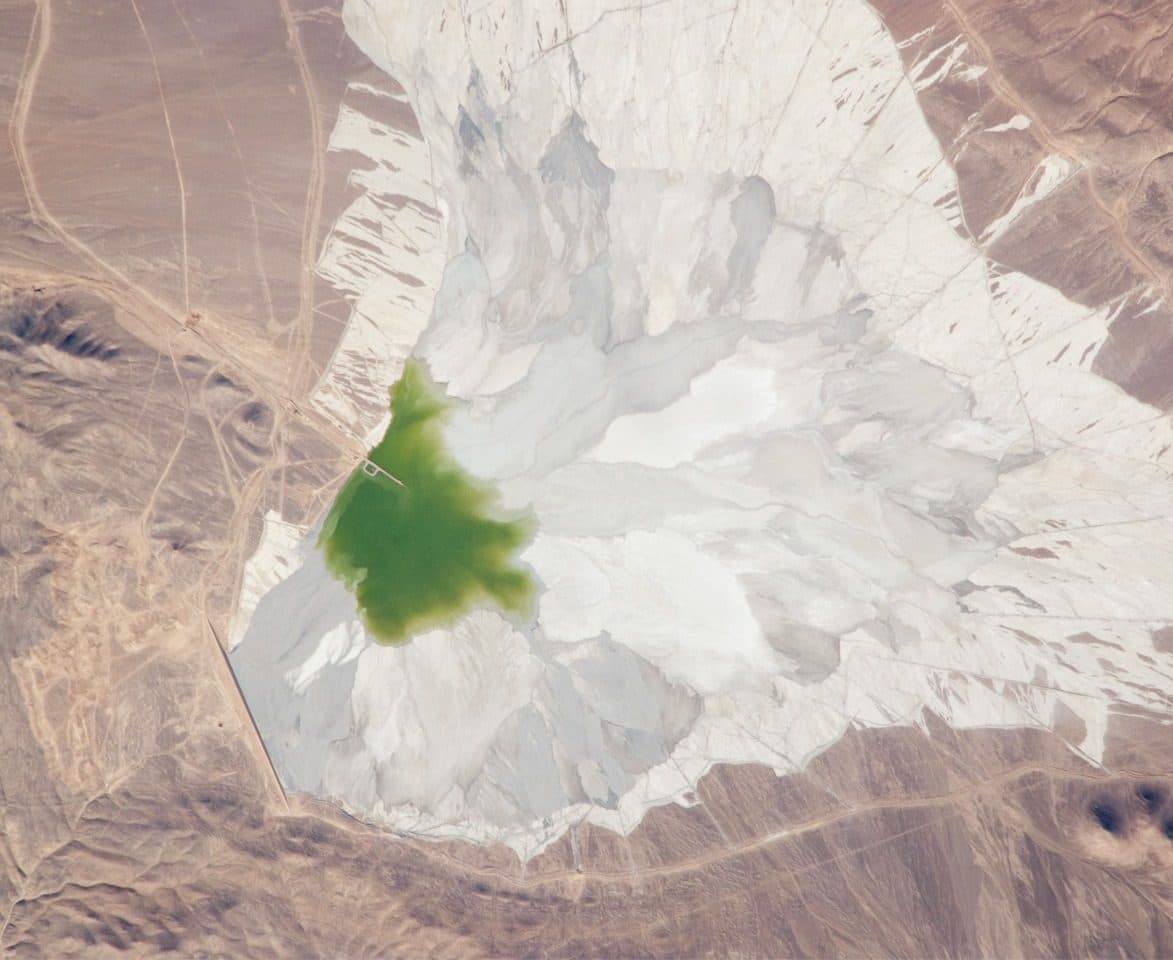
What changed, what it means, and what to do.
When something moves, we tell you what it is, how sure we are and which of your products it touches. Every finding is corroborated across independent sources, in any language, before it reaches you.
MORE ON THE PLATFORM →Watched
in the open.
We publish our monitoring of industrial sites around the world on the RondoTrace Ledger, updated every month. Most companies keep their method behind a sales call. We think you should see the evidence before you talk to us.
Open the Ledger →Loading the latest Ledger entries…

In depth 2026-01 · Value-Chain Evidence After the Omnibus
Companies increasingly have to make judgements about their value chain without being able to obtain all of the underlying information from the value chain itself. Our first In depth publication sets out a framework for doing it well.