Ground displacement, vegetation health, air quality, emissions, deforestation, labour indicators, route disruption — what each reveals and why it matters for your supply chain.
RondoTraceApril 20269 min read
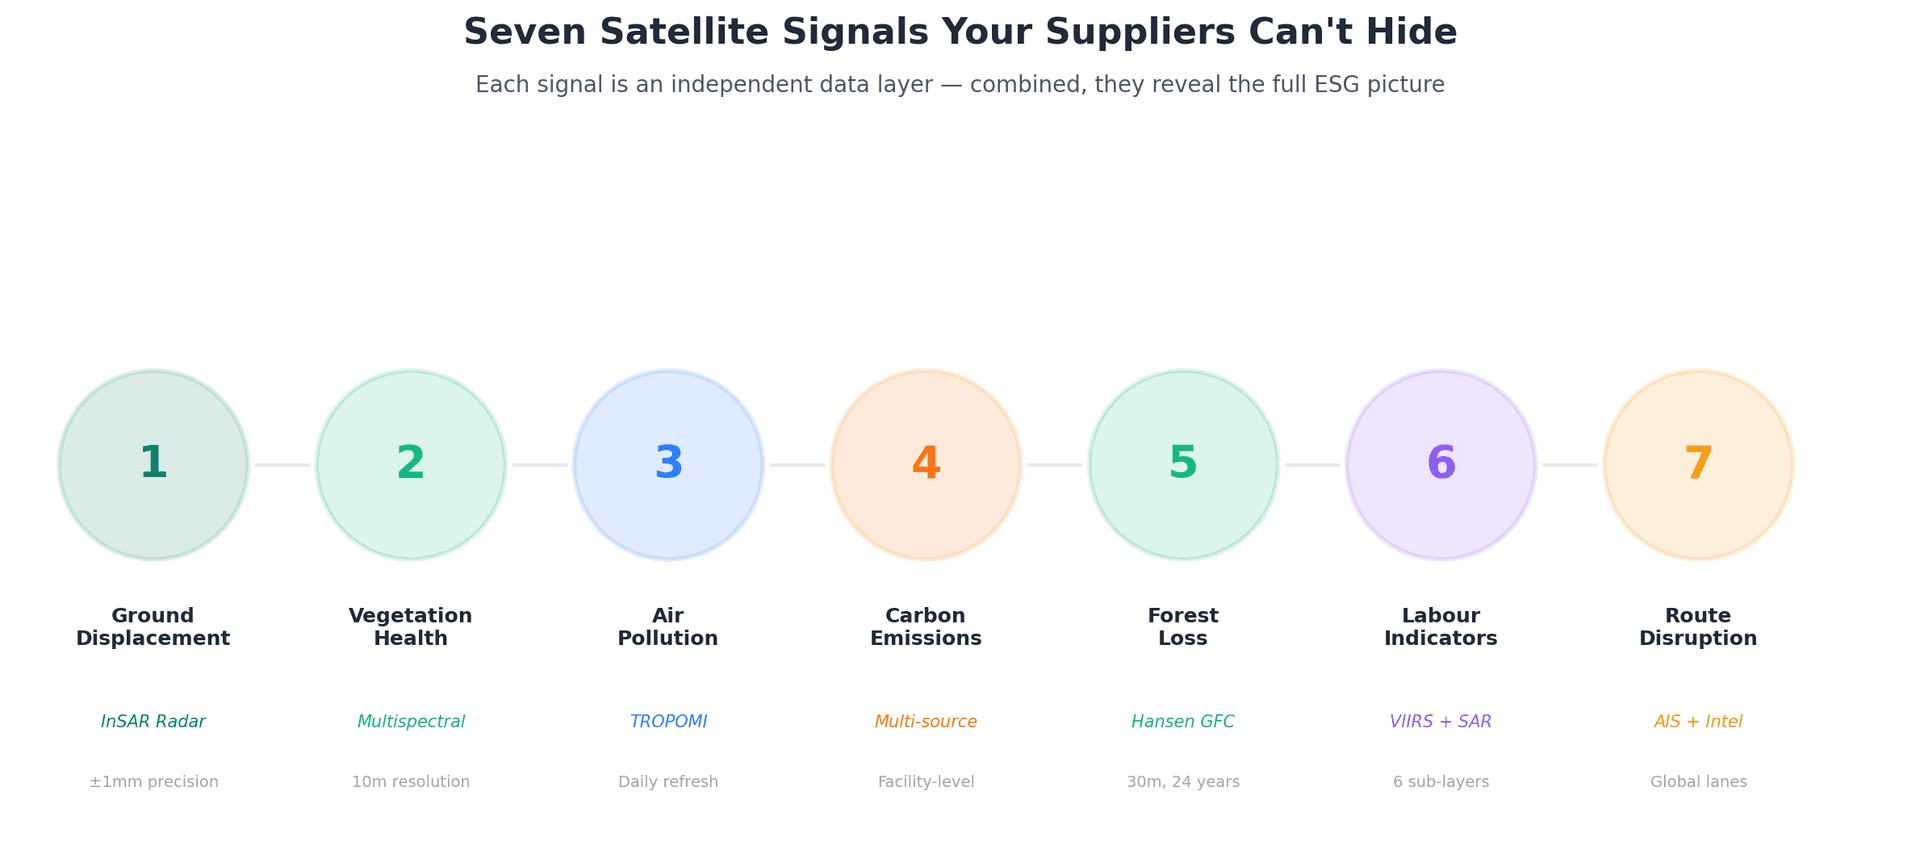
Most companies think satellite monitoring means taking pictures from space. It doesn’t. Modern satellite intelligence extracts seven distinct types of signal from orbital data — each revealing a different dimension of what is actually happening at a supplier’s facility, whether or not the supplier chooses to disclose it.
These signals work across every industry with physical supply chains: automotive, electronics, mining, food and agriculture, chemicals, energy. The specific questions change — an automotive OEM worries about steel supplier stability, a food company worries about palm oil deforestation, an electronics manufacturer worries about cobalt sourcing conditions — but the underlying satellite data answers all of them.
This article explains what each signal detects, how it works, and why it matters for supply chain risk management across industries. No jargon, no theory — just what satellites can actually see and what it means for your procurement decisions.
The seven independent data layers that form a complete ESG intelligence picture. Each operates on different satellite sensors and physics, meaning they cross-validate each other.
Signal 1: Ground Displacement (InSAR Radar)
Sentinel-1 satellites transmit C-band radar pulses every 12 days. By comparing the phase of returned signals across dozens of passes, we reconstruct precisely how every point on a structure has moved over time. This technique, called InSAR, achieves ±1mm precision over areas spanning hundreds of square kilometres.
Ground displacement is not just a mining problem. Steel blast furnaces sit on foundations that settle. Chemical storage tanks on soft ground shift. Port infrastructure subsides. Refinery cooling ponds deform. Any facility with heavy structures, retained earth, or fluid storage is a candidate for displacement monitoring. A steel supplier’s slag dump showing accelerating settlement is a structural risk signal that an automotive OEM’s procurement team would never see in a supplier questionnaire — but it’s clearly visible from orbit.
“At Brumadinho, our AI engine detected 120.5mm of displacement and predicted the dam collapse within 16 days — while every ground sensor showed normal.”
Signal 2: Vegetation and Environmental Health (Multispectral)
Sentinel-2 captures imagery in 13 spectral bands every 5 days at 10-metre resolution. The Normalised Difference Vegetation Index (NDVI) measures plant health; NDWI measures water presence; bare soil indices detect exposed earth. By establishing monitoring zones — the facility itself, a surrounding buffer, and a distant control area — we distinguish site-specific impact from regional background patterns like seasonal rainfall or drought.
A food company sourcing palm oil needs to know whether agricultural land around a plantation is degrading. An automotive OEM wants to verify that a battery materials supplier isn’t contaminating downstream water courses. A pharmaceutical company needs evidence that its API manufacturing partner isn’t causing soil contamination outside the facility boundary. Multispectral monitoring answers all of these questions continuously, without site access.
Signal 3: Air Quality and Atmospheric Pollution (TROPOMI)
The TROPOMI instrument on Sentinel-5P measures atmospheric composition daily at 5.5km resolution. By analysing tropospheric column densities of key pollutants and comparing them against WHO and local regulatory thresholds, we build an air quality profile for any location on Earth. We distinguish facility-specific emissions from regional background by comparing the site against upwind control zones.
“A chemical plant that suddenly shows elevated SO₂ has changed its process or feedstock. A smelter with rising NO₂ has increased throughput. A factory with anomalous formaldehyde may have shifted to cheaper, more toxic inputs. These atmospheric signatures are impossible to hide.”
Signal 4: Carbon Emissions Estimation
We combine satellite-derived atmospheric data with Climate TRACE facility records, national grid emission factors, and industry-specific combustion ratios to estimate emissions at the individual site level. NO₂-to-CO₂ proxy methods allow us to infer CO₂ output from satellite-observable nitrogen dioxide plumes. Changes in the SO₂/NO₂ ratio can indicate fuel switching — from coal to gas, for example — even before the operator reports it.
CBAM will require verified emissions data for imported steel, aluminium, cement, fertiliser, and hydrogen from 2026. CSRD requires Scope 3 upstream emissions disclosure. Companies that cannot demonstrate they know the carbon footprint of their suppliers’ operations will face regulatory exposure. Satellite-derived emissions estimates provide an independent baseline that doesn’t rely on supplier self-reporting — and they detect changes in real time, not at the end of a reporting cycle.
Signal 5: Deforestation and Land Use Change
The Hansen Global Forest Change dataset provides 30-metre resolution annual tree cover loss data spanning 2000–2024. GLAD and RADD alerts detect near-real-time forest disturbance. The JRC 2020 forest mask provides the baseline for EUDR compliance. ESA WorldCover classifies land use at 10-metre resolution. By combining these datasets within a buffer around a supplier’s site, we generate a complete deforestation risk profile.
EUDR applies to soy, palm oil, wood, rubber, cocoa, coffee, and cattle — and requires geolocation-level evidence of deforestation-free sourcing. But deforestation risk extends beyond these commodities. A cobalt mine expanding into primary forest triggers CSDDD environmental due diligence obligations. A steel supplier’s charcoal sourcing from cleared Cerrado land creates reputational risk. Satellite deforestation monitoring provides the geolocation evidence that EUDR demands and the continuous verification that CSDDD requires.
Signal 6: Human Rights and Labour Indicators
This is the most multi-layered signal, combining six independent sub-analyses. VIIRS nighttime lights data detects anomalous operating patterns — a factory that suddenly operates 24/7 when it previously shut down at night may indicate forced overtime. Sentinel-2 NDBI tracks rapid facility expansion that may correlate with capacity increases achieved through exploitative labour. Bare soil indices detect artisanal and small-scale mining activity near industrial mines — a known indicator of child and forced labour in cobalt, gold, and tin supply chains.
The electronics industry faces intense scrutiny over cobalt sourcing in the DRC. Automotive OEMs face CSDDD obligations around labour conditions at battery material suppliers. Food companies face Modern Slavery Act reporting requirements for agricultural supply chains. Satellite-derived human rights indicators don’t replace on-the-ground investigation, but they identify which sites warrant investigation — and they do it across thousands of sites simultaneously, continuously, without the supplier controlling what is visible.
Signal 7: Transportation and Route Risk
This module fuses AIS vessel tracking data, real-time news and intelligence monitoring across 120+ languages, commodity market stress indicators, and regulatory databases (CBAM, EUDR, UFLPA, sanctions lists) to assess risk across global logistics corridors. It evaluates six dimensions: geopolitical risk, chokepoint exposure, port and infrastructure conditions, freight market stress, regulatory compliance, and security threats.
The Red Sea crisis forced rerouting via the Cape of Good Hope, adding 10–14 days and 18–22% to logistics costs for Asia-Europe trade. Strait of Hormuz tensions affect energy and chemical supply chains. Panama Canal drought restrictions limit trans-Pacific capacity. These disruptions affect every industry with ocean freight exposure. Route risk monitoring gives procurement teams advance visibility into corridor degradation before it becomes a supply interruption.
How Signals Combine: The Cross-Industry Picture
These seven signals are powerful individually, but transformative in combination. A tailings dam showing accelerating displacement (Signal 1) becomes far more urgent when the same site simultaneously shows declining buffer vegetation (Signal 2), elevated particulate emissions (Signal 3), and unusual nighttime operations (Signal 6). Each signal cross-validates the others, reducing false positives and building a composite risk picture that no single data source can provide.
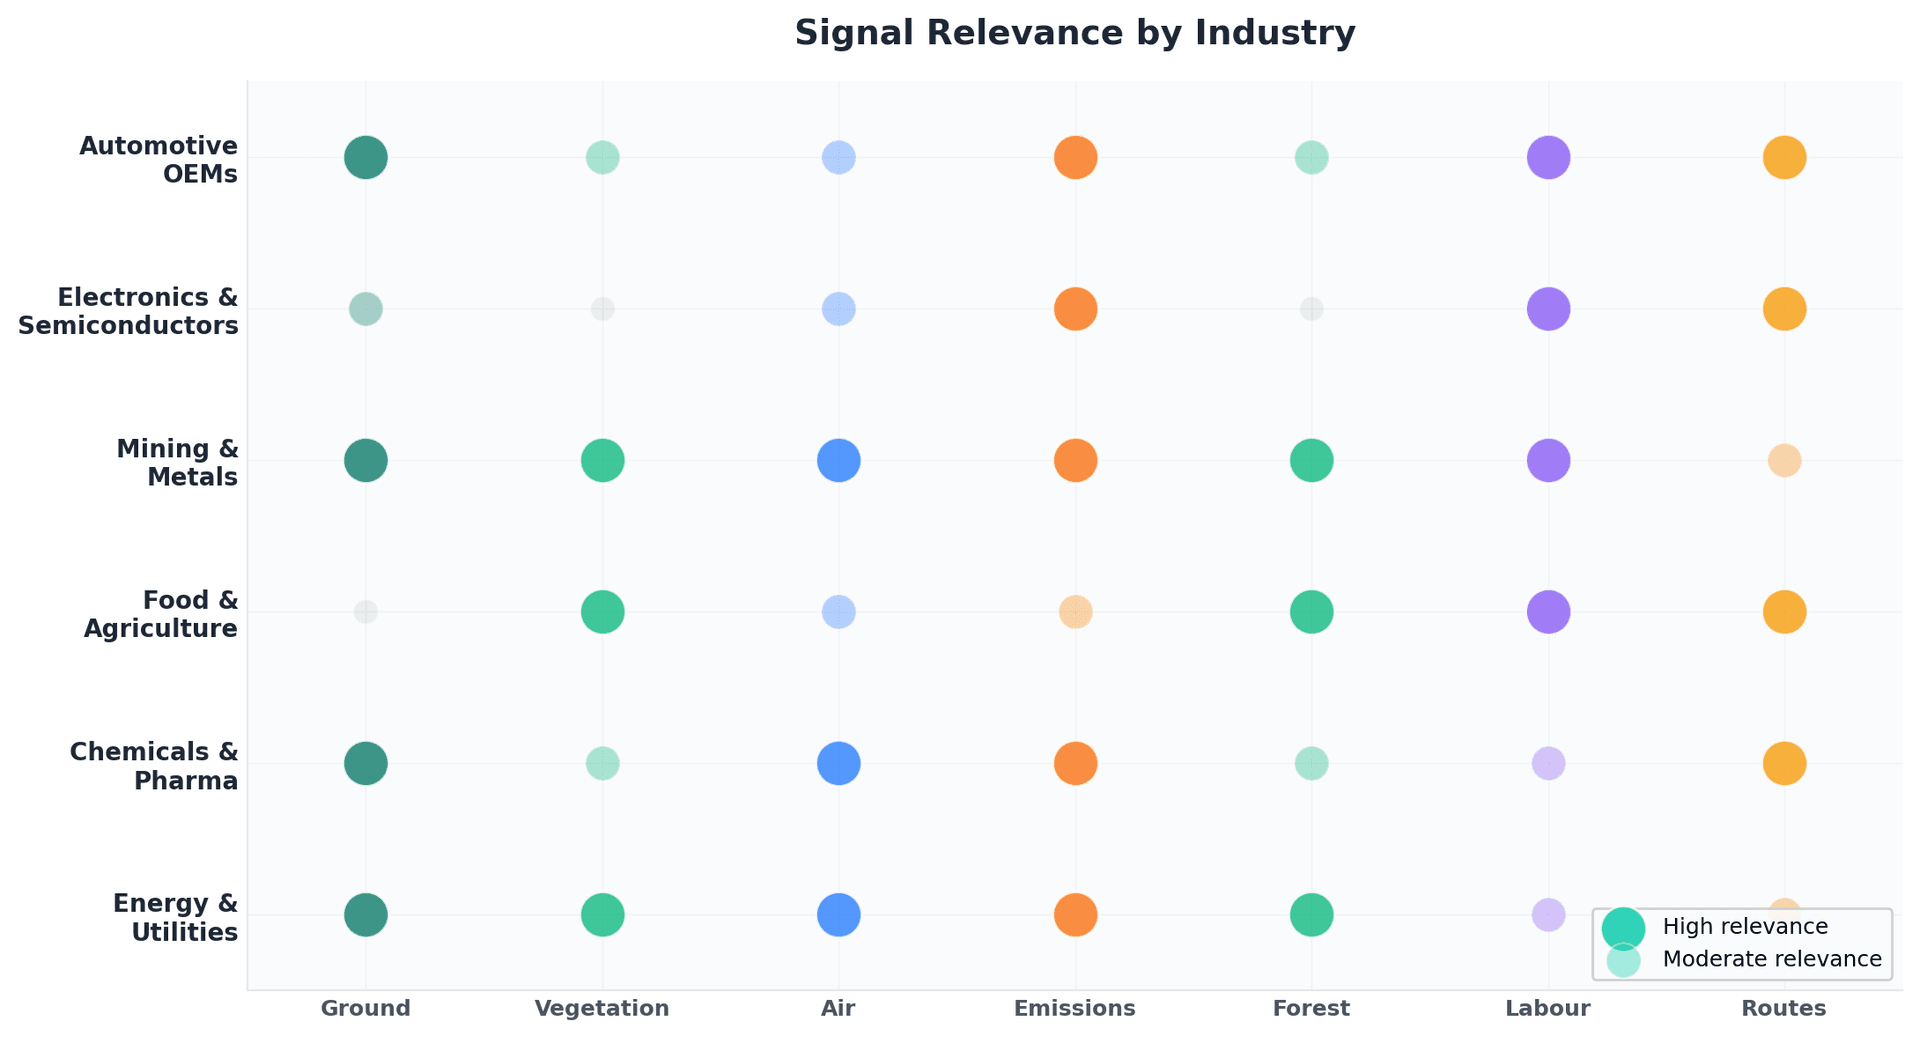
Signal relevance varies by industry, but every sector benefits from multiple signal types. The platform adapts its analysis to the buyer’s specific supply chain structure.
“The same satellite data infrastructure monitors all seven signals simultaneously. Adding a new supplier site doesn’t require new sensors, new data sources, or new infrastructure. The satellites are already collecting the data. The AI engine simply analyses a new coordinate.”
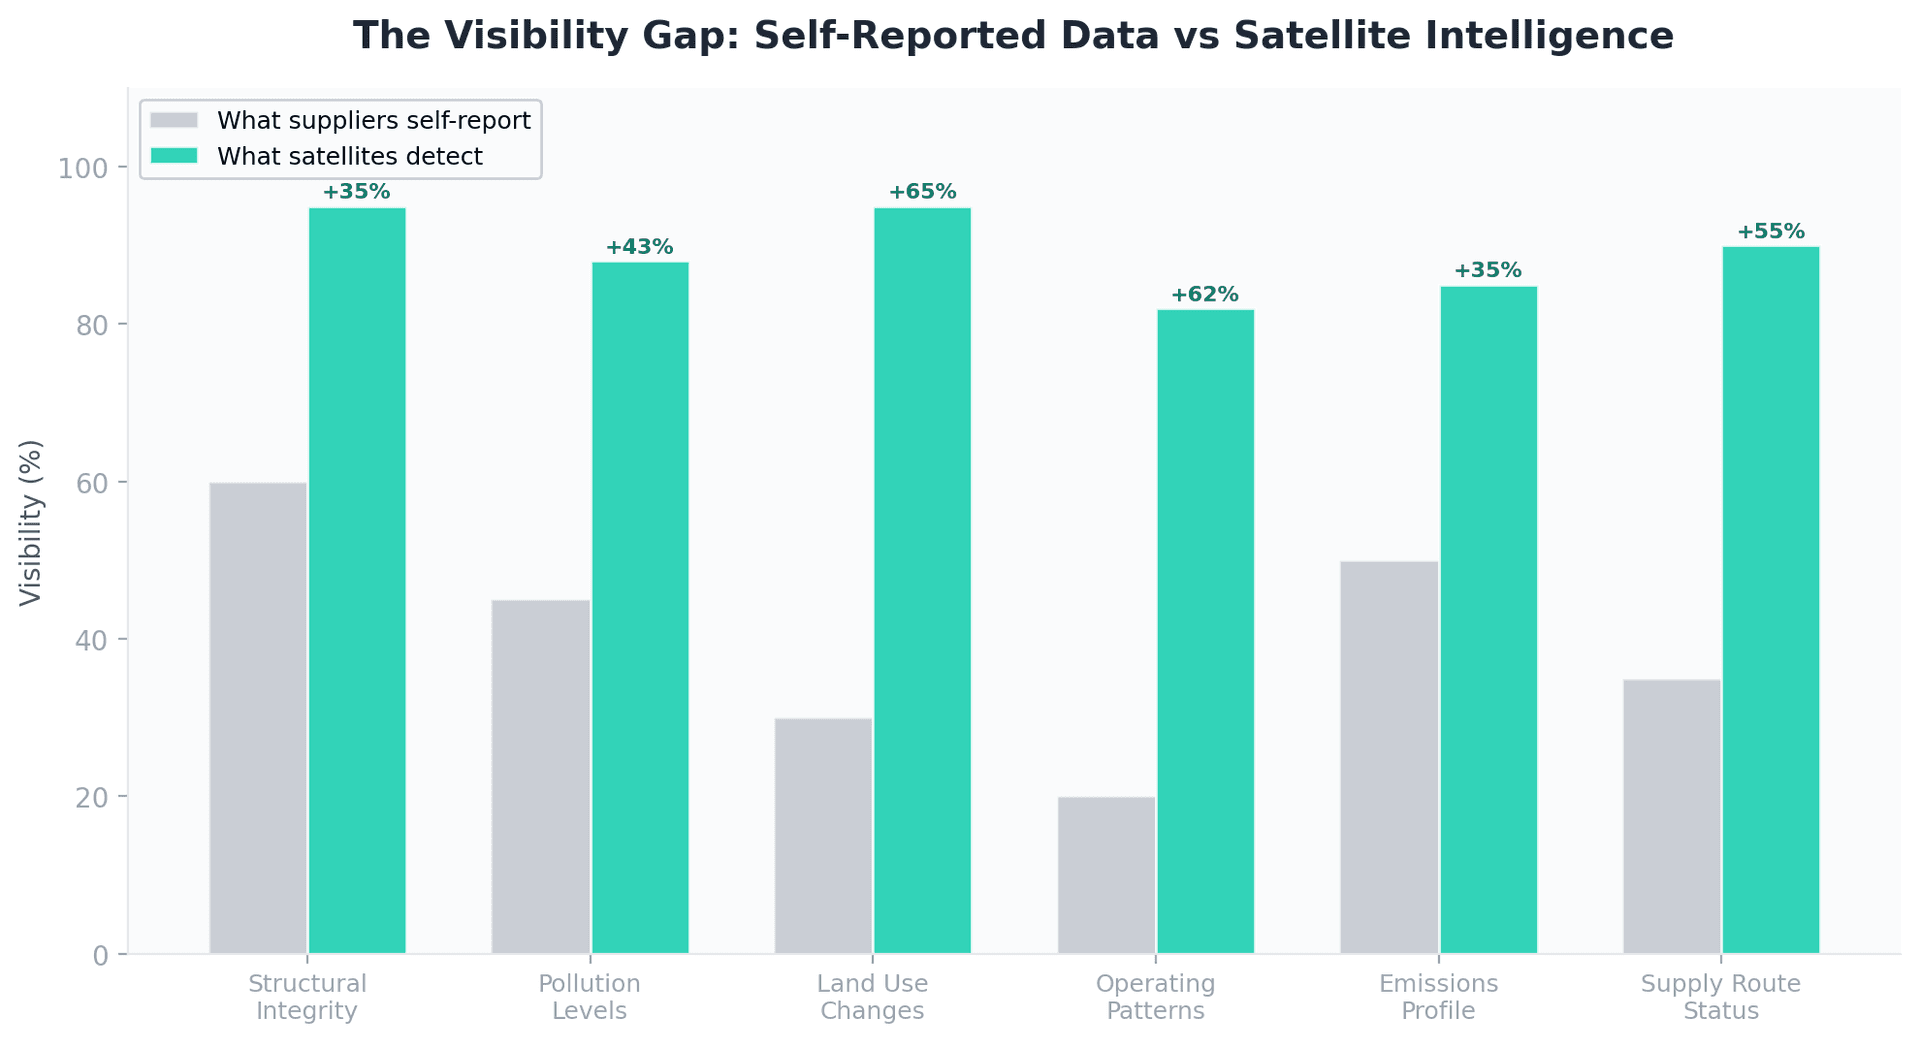
The Visibility Gap
The gap between what suppliers choose to disclose and what satellites can independently verify is substantial — and it grows wider for the signals that matter most.
The gap is widest for operating patterns and land use changes — precisely the areas where CSDDD and EUDR require the most rigorous due diligence.
This gap is not necessarily because suppliers are dishonest. Many genuinely don’t have the instrumentation or monitoring systems to know what’s happening at the margins of their operations. Satellite intelligence reveals what no one on the ground is measuring — including things the operator themselves may not be aware of.
From Signal to Action
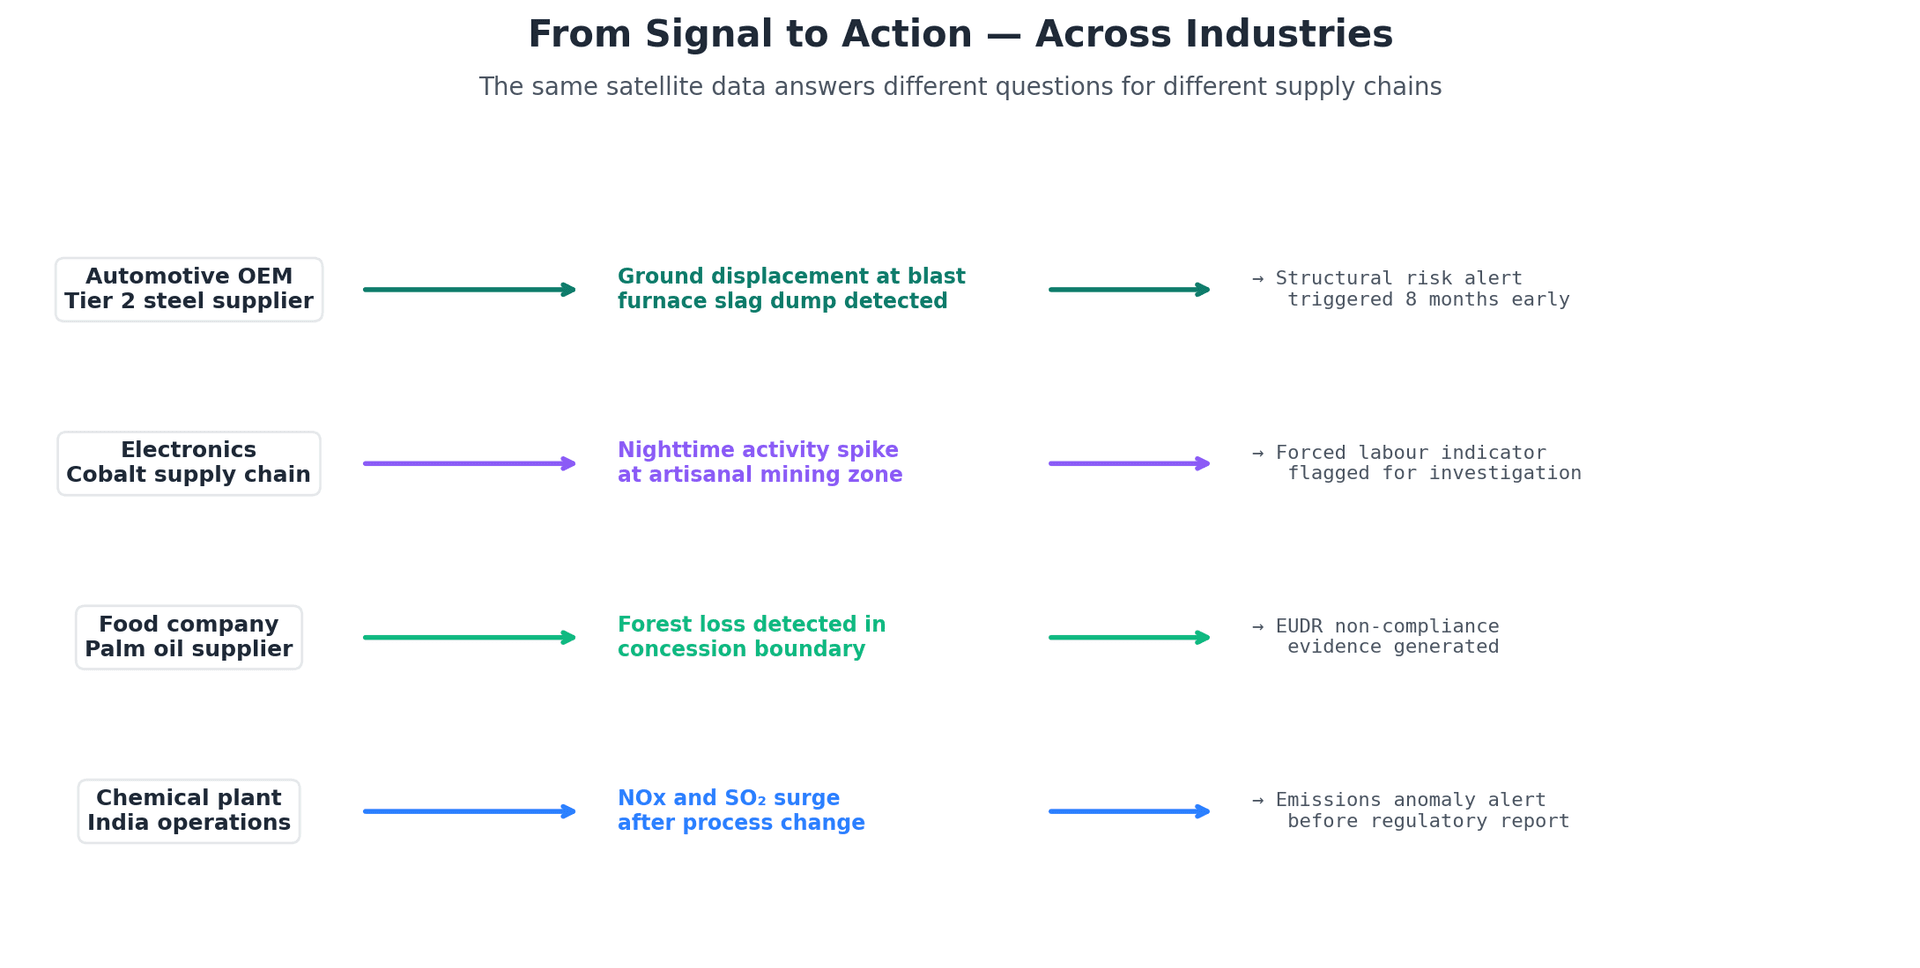
Each industry faces different risks, but the workflow is identical: satellite signals trigger investigation, investigation triggers engagement, engagement drives remediation or sourcing decisions.
Four real-world scenarios showing how the same satellite intelligence platform serves different industries and supply chain structures.
“The intelligence doesn’t come from the supplier. It doesn’t come from an audit that the supplier prepared for. It comes from physics — radar reflections, spectral signatures, atmospheric chemistry — processed through AI that doesn’t care about commercial relationships or reporting incentives.”
About RondoTrace
RondoTrace
AI-Powered Satellite Intelligence for Supply Chain Risk
RondoTrace is an AI-powered satellite intelligence platform for supply chain ESG and risk monitoring. We process radar interferometry, multispectral imagery, and atmospheric composition data through proprietary multi-layer analysis algorithms to provide continuous, independent monitoring of supplier sites globally.