 RondoTrace
The site from orbitYankee Doodle tailings impoundmentTailings facility at an operating copper mine · United States
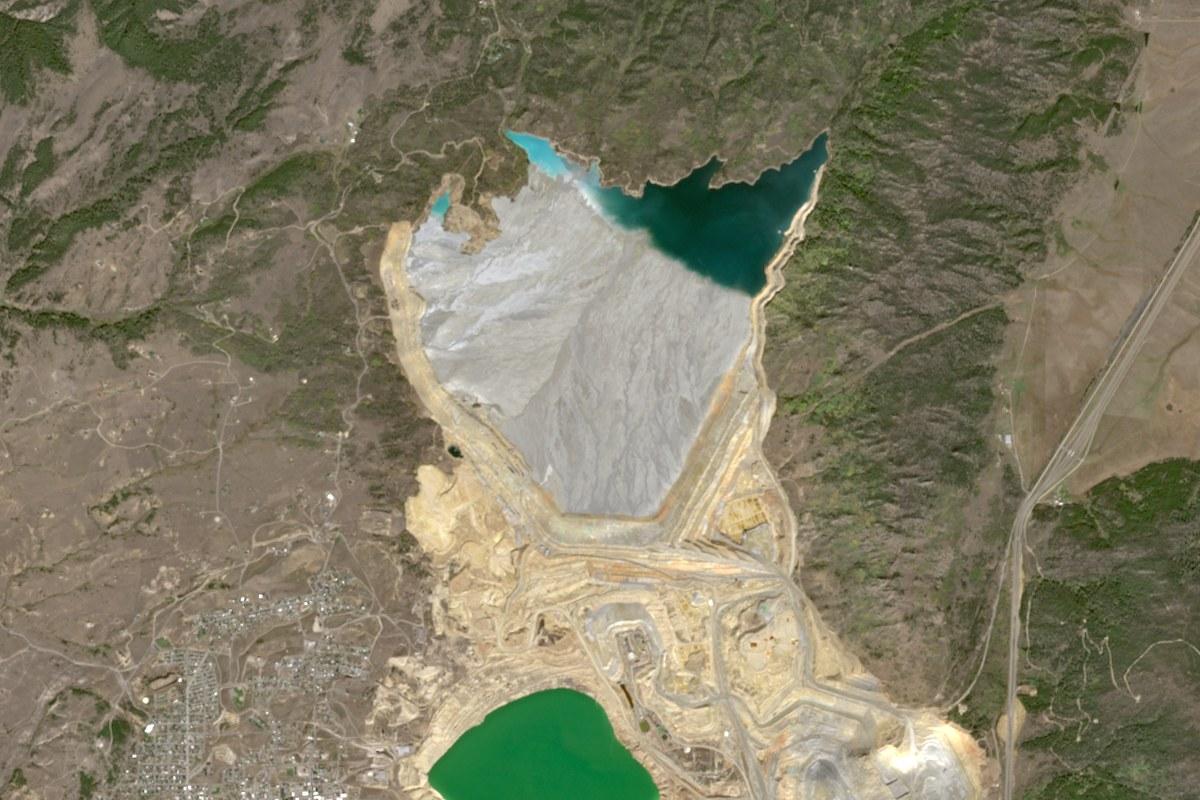
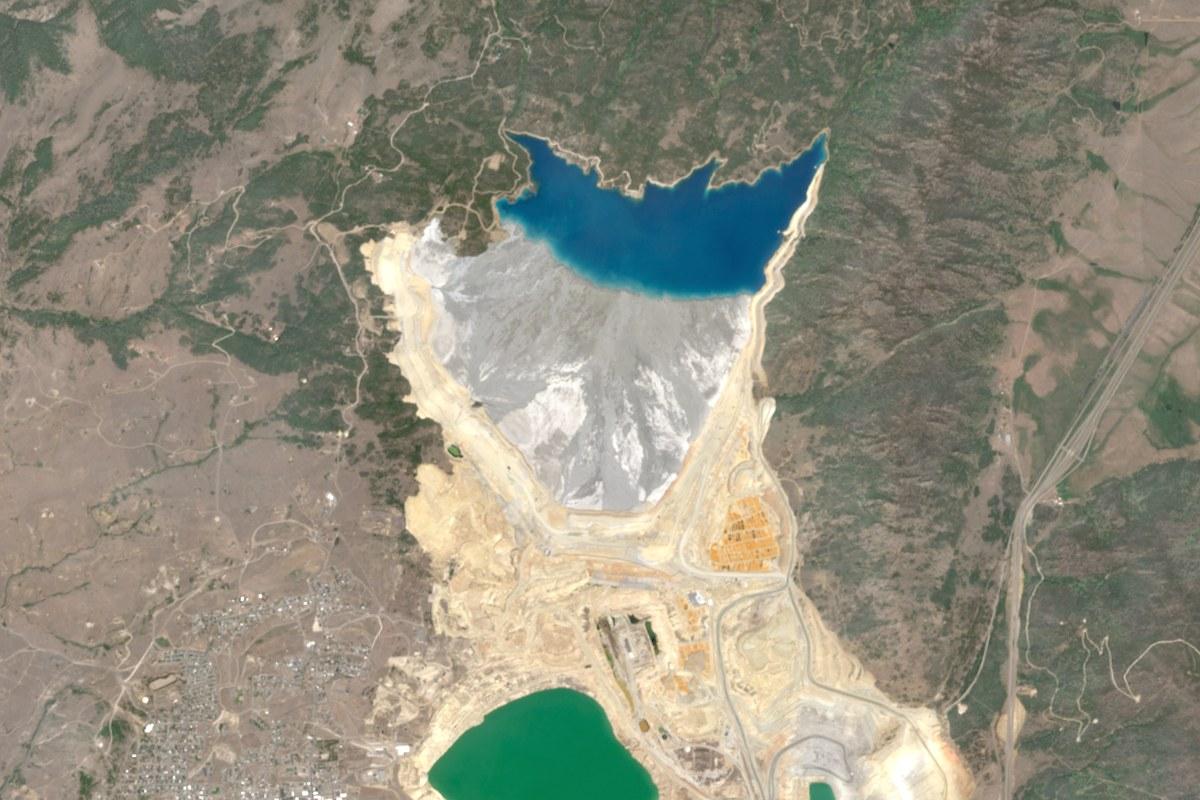
Drag the slider to compare July 2021 with September 2026. Click a number to see what we noticed there.
This view is about 10 km across, with north at the top. One more number appears on the later image when you drag the slider to the left.
Our view of Yankee Doodle tailings impoundment (Montana Resources)
We would inspect this site first. It is the only one of the five where we see the dam itself moving, although the movement is steady and does not look urgent.
Why we say this
The top of the central embankment is sinking by 88 to 121 millimetres a year at an even pace, which is normal for newly placed rock.
With 2 visits this quarter, we would go to Yankee Doodle tailings impoundment and Talabre tailings deposit first.
A black square means the wet season falls in the coming months.
This is the order in which we would visit them. Choose a row to see that site.
- Your 2 visits end here
- 1.Put this site first on the inspection list for the quarter.
- 2.Ask the operator for its own survey readings on the embankment crest for the same twelve months, and compare the rates.
- 3.Ask how much rock was placed on the central embankment this year, because newly placed fill would explain steady settlement.
- If we see: Movement that speeds up from one reading to the nextThe settlement is no longer even. That is the sign to send someone at once.
- If we see: The stable ground nearby starting to moveEither the cause is wider than the embankment or our measurement needs checking.
- If we see: Any sign of heatA tailings facility should show none. If we see heat, we would ask what burned.
Movement of the top of the central embankment since 7 November 2025, seen from one side (millimetres)
We measured this from Nov 2025 to Nov 2026. The latest reading is −88.5 millimetres. A break in the line is a period in which we have no reading.
measuredThe same point since 8 November 2025, seen from the other side (millimetres)
We measured this from Nov 2025 to Oct 2026. The latest reading is −117.9 millimetres. A break in the line is a period in which we have no reading.
measuredSigns of heat in each six-month period (detections)
We measured this from Oct 2024 to Oct 2026. The latest reading is 0 detections.
measuredWe measured these sites up to November 2026. Every figure is one of our measurements or a linked public record. A dotted line carries the measured pace forward. It is not a forecast.
Check your own site →