 RondoTrace
The site from orbitTalabre tailings depositTailings facility at an operating copper mine · Chile
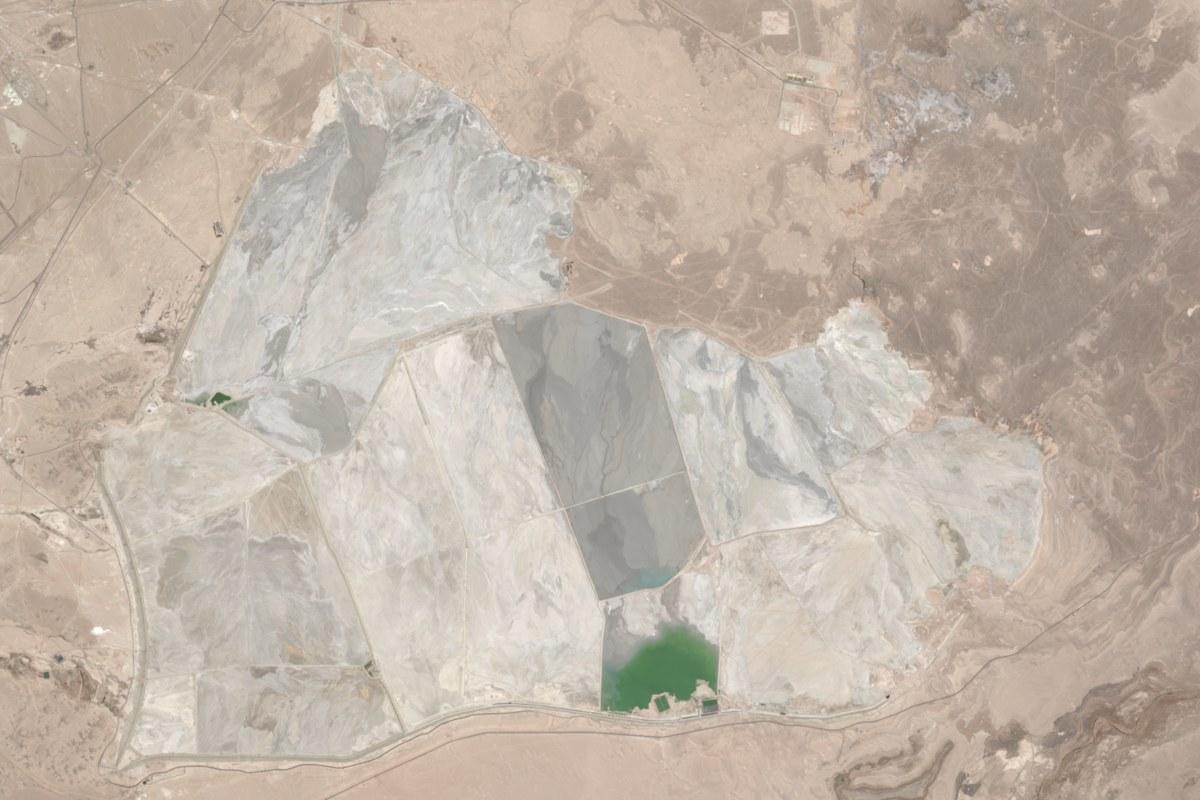
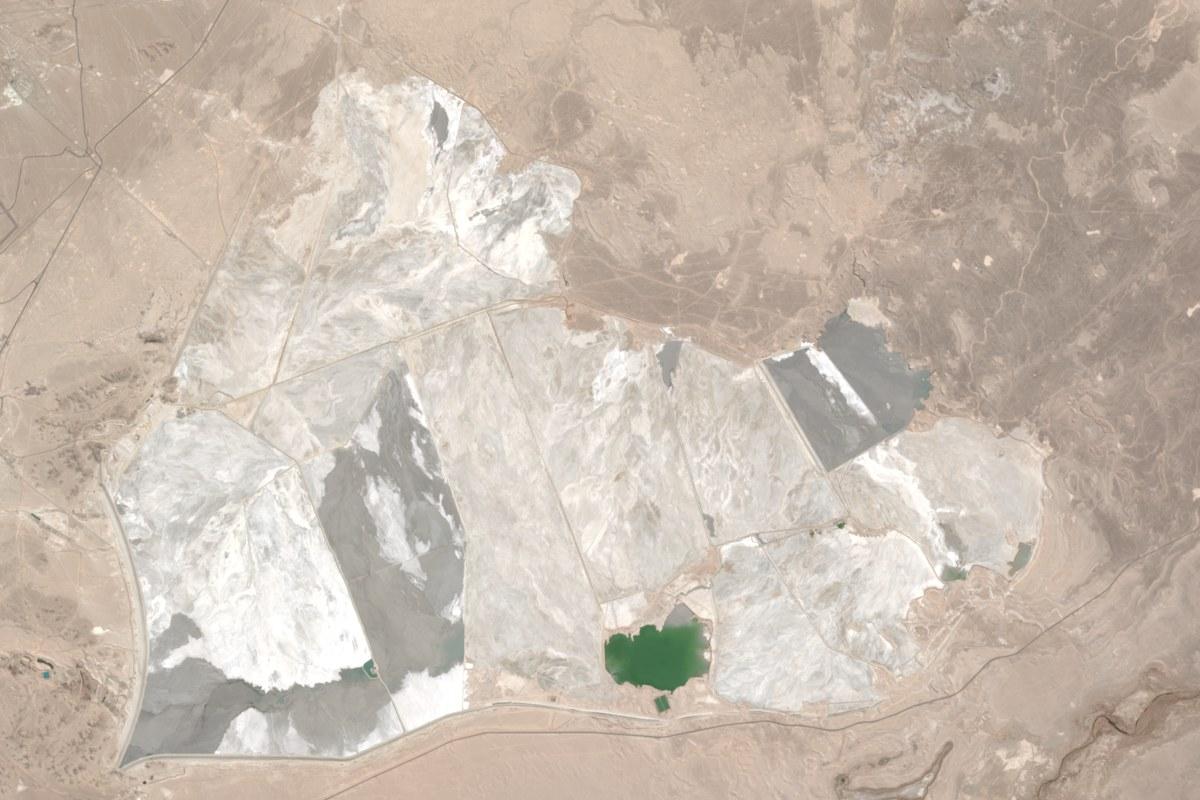
Drag the slider to compare August 2021 with September 2026. Click a number to see what we noticed there.
This view is about 16 km across, with north at the top.
Our view of Talabre tailings deposit (Codelco)
The wet area on your deposit is the smallest we have measured, 9% below a year ago. If that was planned, there is nothing to do. If it was not, we would look into it before a reviewer asks.
Why we say this
It was 493 hectares in May to October 2026, against 542 hectares in the same months of 2025.
Your alarm would have rung once between October 2024 and October 2026. The latest reading is already past your level.
Your alarm rings when the wet area in each six-month period falls to 500 hectares or less. We count one ring each time it reaches that level. This record has 9 readings.
Wet area in each six-month period (hectares)
We measured this from Oct 2024 to Oct 2026. The latest reading is 493 hectares.
measuredyour level- 1.Check the 493 hectare reading against your own pond survey for October 2026.
- 2.Tell us which cell was in use from May to October, so that the next reading is compared like with like.
- 3.Set the alarm where your operating plan says the wet area should not go, not where our record happens to sit.
- If we see: A second low readingThis would tell us that the drop is lasting and was not a single low reading.
- If we see: A wet area above 610 hectaresThere would be more wet ground than in any period since May 2024.
- If we see: Any sign of heatA tailings facility should show none. If we see heat, it is worth checking what burned.
Signs of heat in each six-month period (detections)
We measured this from Oct 2024 to Oct 2026. The latest reading is 0 detections.
measuredWe measured these sites up to November 2026. Every figure is one of our measurements or a linked public record. A dotted line carries the measured pace forward. It is not a forecast.
Check your own site →