 RondoTrace
Tailings dam monitoring by satellite
Last updated:
In short
Tailings dam monitoring by satellite measures two things from orbit: movement of the embankment, in millimetres, and the wet area on the facility. RondoTrace tracks both against each dam's own record, so an owner, regulator or insurer can see which facilities have changed. It supports the engineer's instruments and inspections and does not replace them.
What it is
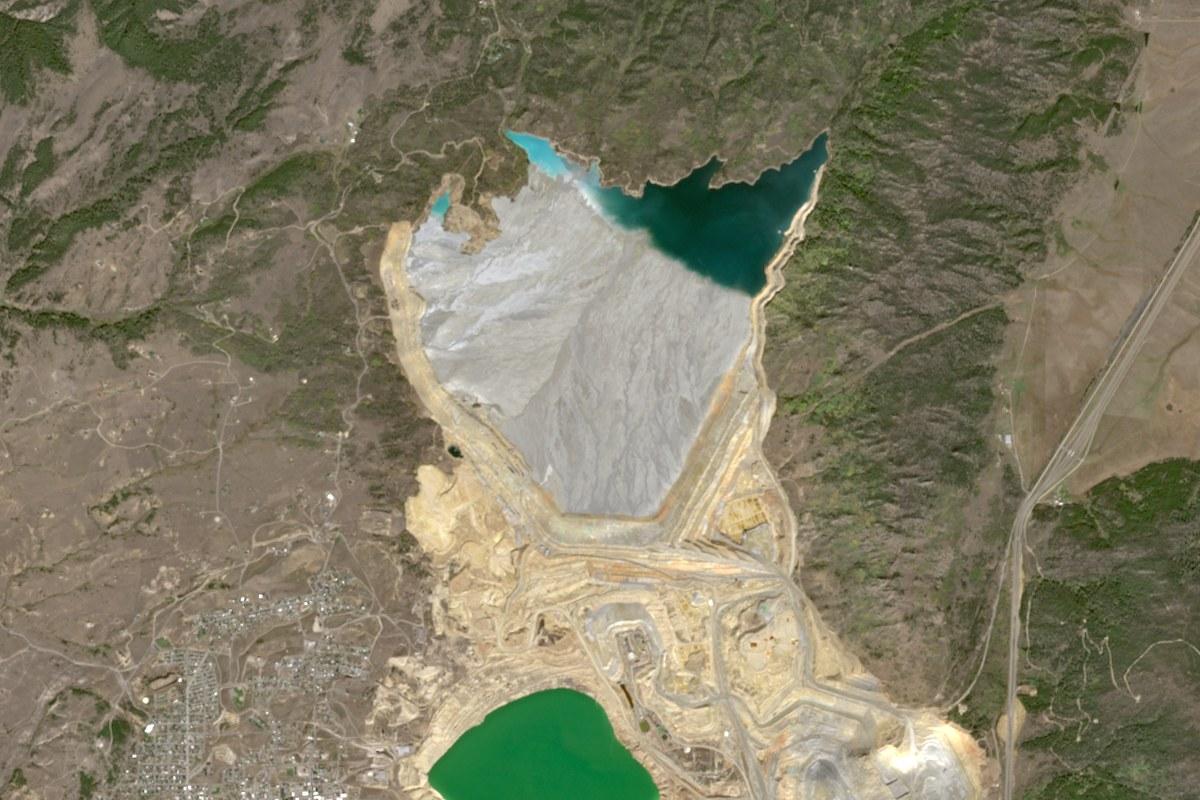
A tailings facility stores the fine waste from a mine behind an embankment. Its safety depends on the structure and on how water is managed. Monitoring it by satellite means measuring, on a regular cycle, how far chosen points on the embankment have moved and how much of the surface is wet, and comparing both with the facility's own history.
How it works in practice
Ground movement is measured by radar, which works through cloud and at night. We pick points on the embankment that reflect well and measure each from two viewing directions where we can. The result is a line of readings a few times a month. Wet area is measured from images and reported by six-month period. It changes with the season, so a period is compared only with the same months of an earlier year.
For a portfolio, we put the facilities in an order for inspection. The order says where to look first. It does not say one dam is safer than another. Our article on what satellites can tell you about a tailings dam has more.
A worked example: the Yankee Doodle impoundment
The Yankee Doodle tailings impoundment in the United States is one of five facilities ranked for inspection in our Outlook tool for regulators. Between 7 November 2025 and 9 November 2026 the top of its central embankment moved by about 88 millimetres as seen from one side. Seen from the other side, the same point had moved by about 118 millimetres by 29 October 2026.
That is a rate of 88 to 121 millimetres a year at an even pace, which is normal for newly placed rock. We ranked it first because it is the only one of the five where we see the structure itself moving. We describe the movement as steady and say that it does not look urgent.
Limits
We measure a few chosen points, not the whole embankment. The figures are movement towards or away from the satellite, which on a dam crest is mostly downward. Wet area is an area, not a volume, so it does not say how much water the pond holds. At some facilities the wet-area measure is weak, and we mark it. Nothing here sees inside the dam, where the engineer's instruments and inspections do the work. We do not predict failures, and we do not say how likely one is.
Who uses this and for what
- Owners and operators use it for early notice of change and as independent evidence for reviews.
- Regulators use it to decide which facilities to inspect first.
- Insurers and lenders use it to see whether a facility has changed since they last assessed it.
Questions buyers ask
Can satellite monitoring predict a tailings dam failure?
No. We do not predict failures. We report measured movement and wet area, and say when either departs from the dam's own record. Judging stability is the work of the engineer responsible for the dam, who has instruments inside the structure.
How is embankment movement reported?
In millimetres, at chosen points, from readings a few times a month. Each figure is movement towards or away from the satellite, and we show the whole line of readings so you can see whether the pace is even.
What if a measure does not work at our facility?
Then we tell you. At one facility in our public examples the wet-area figure reads steady whatever happens, and it is published with that warning. A quiet result from a weak measure is not evidence that all is well.
Do you need access to the site or its instrument data?
No. The measurements come from orbit. If you share survey or instrument data, the two records can be compared.
You can try this on real sites in the Outlook tool, ask for a first reading of a site of your own at Check a site, or read Which supply chain risks satellite monitoring can detect, and which it cannot.