 RondoTrace
Five tailings dams, two inspection visits, and a satellite
A satellite cannot tell you whether a dam is safe. It can tell you where to look first. At one of these five sites, it could not even do that, and we say so.
By RondoTrace · 19 November 2026 · 5 min read
Most regulators have more dams than inspectors. So do most mining companies. Every quarter somebody has to decide which sites get a visit and which ones wait.
We took five real tailings facilities, in the United States, Chile and Brazil, and ranked them the way we would if that decision were ours. One of them is moving. One changed its habits last year. Two have nothing to report. And at the last one, our own measurement is not good enough to say anything at all.
This is the work we do at RondoTrace. We follow dams and other industrial sites by satellite, month after month, so that the people responsible for them see a change early and can decide where to look while there is still time to do something about it.
The dam that is sinking, slowly
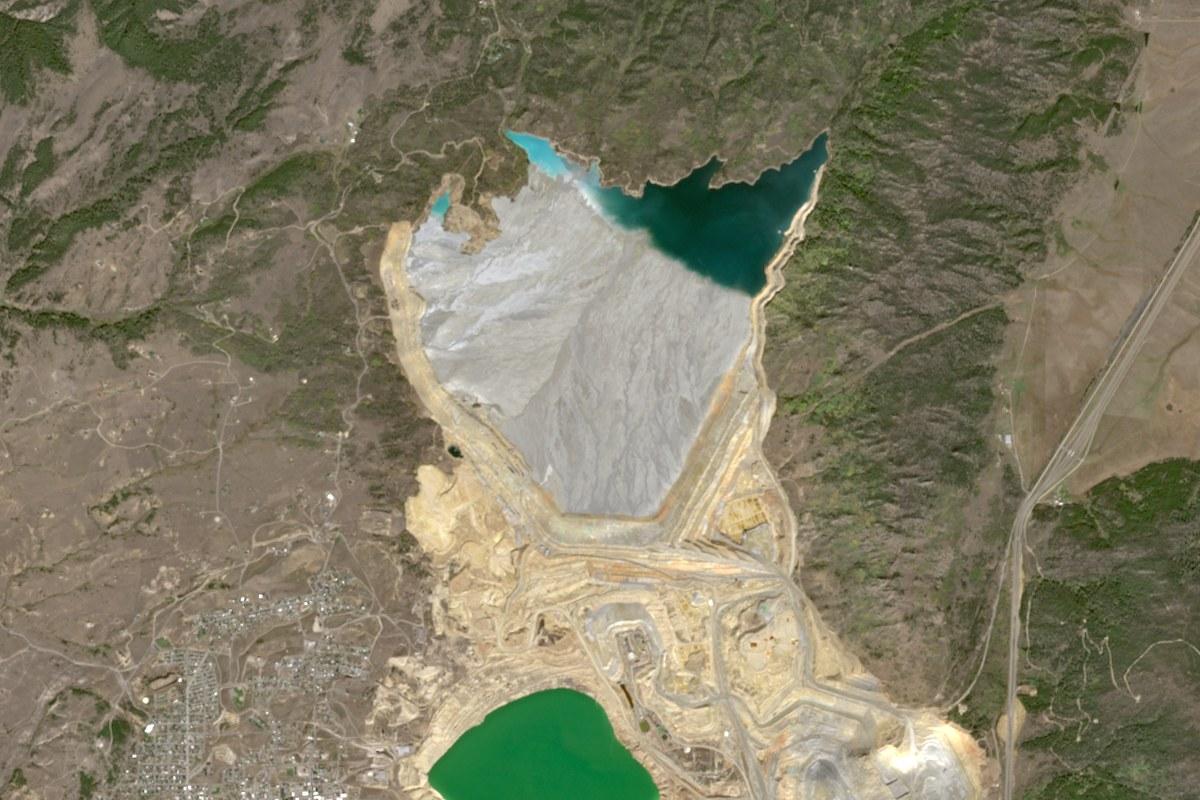
Start in Montana, at a facility called Yankee Doodle. In the picture, the pale band along the lower edge of the grey tailings is the top of the main embankment. It looks the same in every picture we have. A camera cannot see what is happening to it.
Radar can. Measured from two directions between November 2025 and November 2026, the top of that embankment is sinking by 88 to 121 millimetres a year.
That sounds worse than it is. The pace has been even, and newly placed rock settles under its own weight in exactly this way. Still, it is the only one of the five where the dam itself is moving, so it goes first on our list.
What would change our mind is speed. Movement that picks up from one reading to the next is the sign to send someone at once.
The deposit that changed its habits
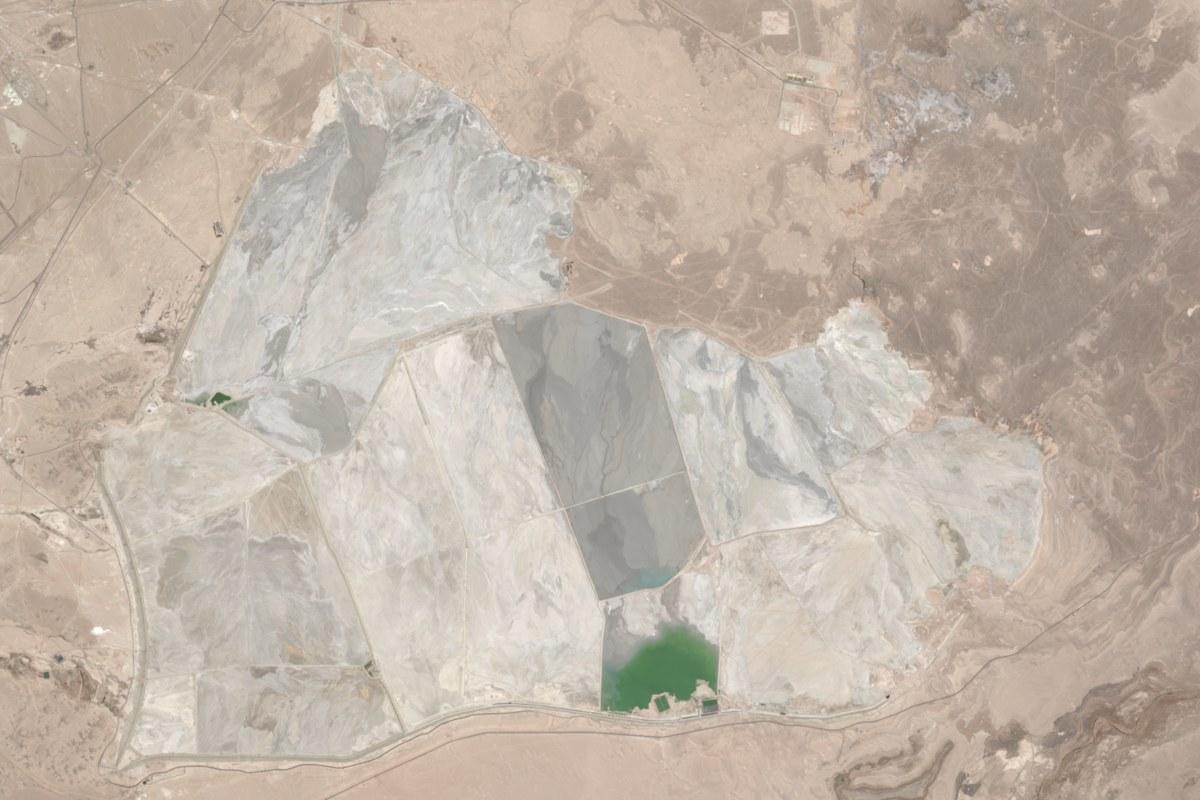
Second is Talabre, a very large deposit in the desert of northern Chile. Here we watch how much of the surface is wet. In May to October 2026 it was 493 hectares. In the same months a year earlier it was 542. That is 9% less, and the lowest figure since our record began in May 2024.
The picture explains why. A cell in the middle of the deposit is dark and damp, while the cells that were damp a few years ago are pale and dry. The operator has started placing tailings in a different part of the site, and that alone can shrink the wet area.
We think something changed in the way this site is run. That is worth a question to the operator today. It is not yet worth one of your two visits.
The two with nothing to report
At Laguna Seca, also in Chile, the wet area is 38% larger than a year ago. It would be easy to make a headline of that. But this site swings between about 490 and 890 hectares within every single year, so what we are seeing is the season.
At Germano, in Brazil, the site looks the same as it did two years ago. We saw three signs of heat there between August and October 2024, and none since. The rainy season runs until March, and that is when a dam like this is under most strain, so we would time the routine visit for the rains.
The one where we do not trust our own number
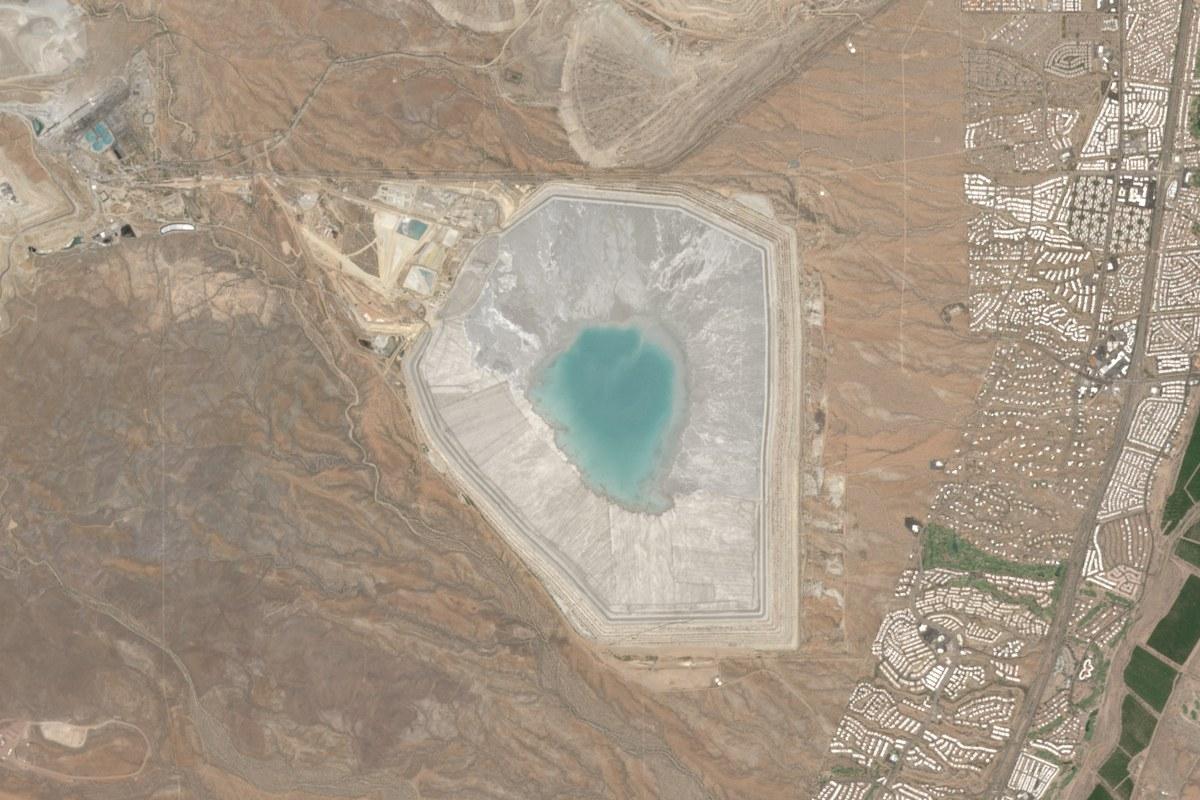
The last site is Sierrita, in Arizona, and it is the one we most want you to read about.
Our wet-area figure there has stayed between 173 and 178 hectares for two and a half years. A number that steady looks reassuring. This one should not reassure anybody. The area we measure at Sierrita is wet in every period, so the figure would read the same even if the pond grew or shrank.
And the pond does seem to have changed. In our pictures it looks larger in June 2026 than it did in June 2021 or June 2024. Our figure stayed flat through all of it.
Sierrita is last on the list only because we have nothing to raise, and nobody should read that as a clean bill of health. People live in the streets just east of the facility. We would ask the operator for its own pond level and seepage records.
The ranking
| Facility | Why it sits there | |
|---|---|---|
| 1 | Yankee Doodle, United States | The only one where the dam itself is moving. Steady, not urgent. |
| 2 | Talabre, Chile | Something changed in how the site is run. Ask the operator now. |
| 3 | Laguna Seca, Chile | A larger wet area, but within its normal yearly swing. |
| 4 | Germano, Brazil | Unchanged in two years. Visit during the rains. |
| 5 | Sierrita, United States | Nothing seen, and our measure is too weak here to rely on. |
The first two places come from something we measured. The order of the last three is our judgement.
What a satellite will never tell you
None of this tells you whether a dam is safe. We do not predict failures, and we do not put a probability on one. What we can do is point an inspector at the right gate, and tell an owner which figure a reviewer will ask about first.
The five facilities are in our free Outlook tool, with a view for regulators and one for owners and operators. To see your own facility the same way, you can ask us to check a site.
Related analysis
More from RondoTrace.

The same methodology, applied to a site you choose.
Forensic retrospective on any supplier site — including yours. We deliver the methodology, the imagery, the dated observations, and the limitations. Thirty days, no commitment.