 RondoTrace
The forest that disappeared between two audits
In one nickel area in Indonesia, forest loss more than quadrupled in a year. A buyer who checks suppliers once a year would have found out up to eleven months late.
By RondoTrace · 19 November 2026 · 5 min read
Most companies check their suppliers once a year. A questionnaire goes out, a questionnaire comes back, and the file is closed until the next one.
The forest does not keep to that calendar.
Closing that gap is the work we do at RondoTrace. We follow sourcing areas and supplier sites by satellite, month after month, so that a sustainability or procurement team sees a change within months and can raise it with a supplier while it can still shape a decision.
A coastline in Indonesia
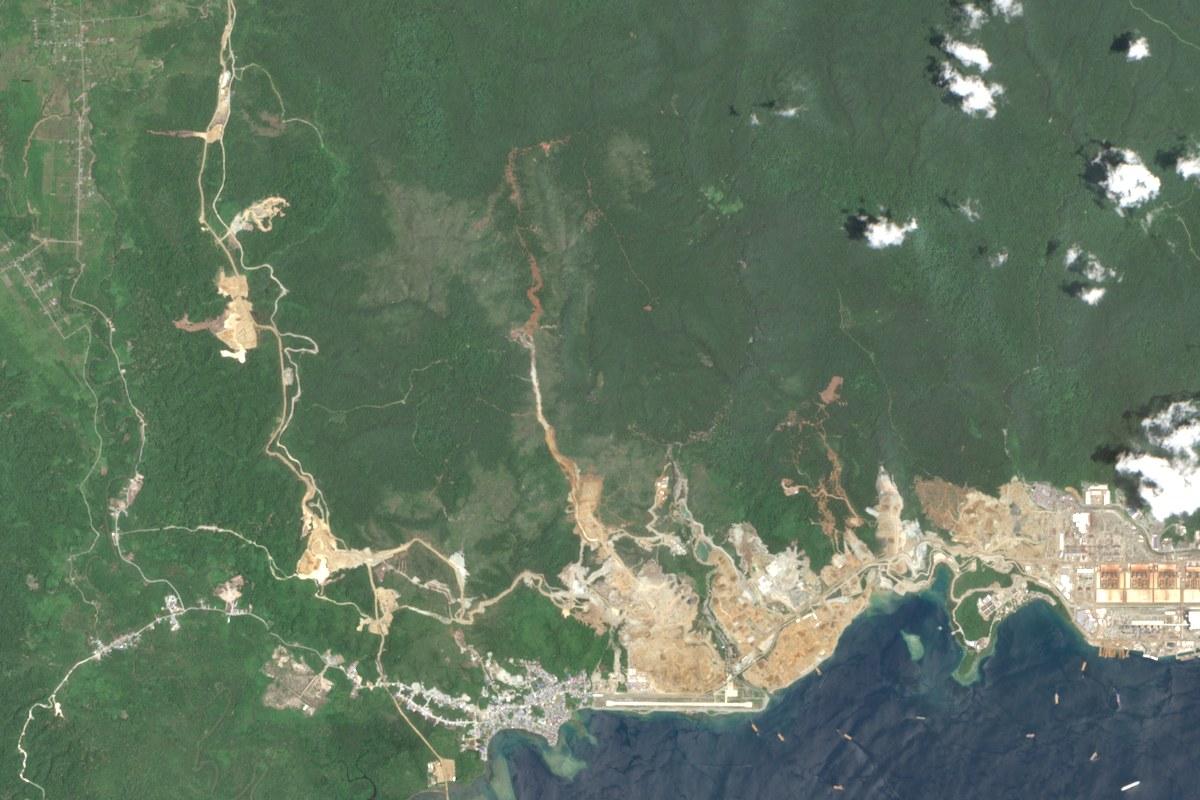
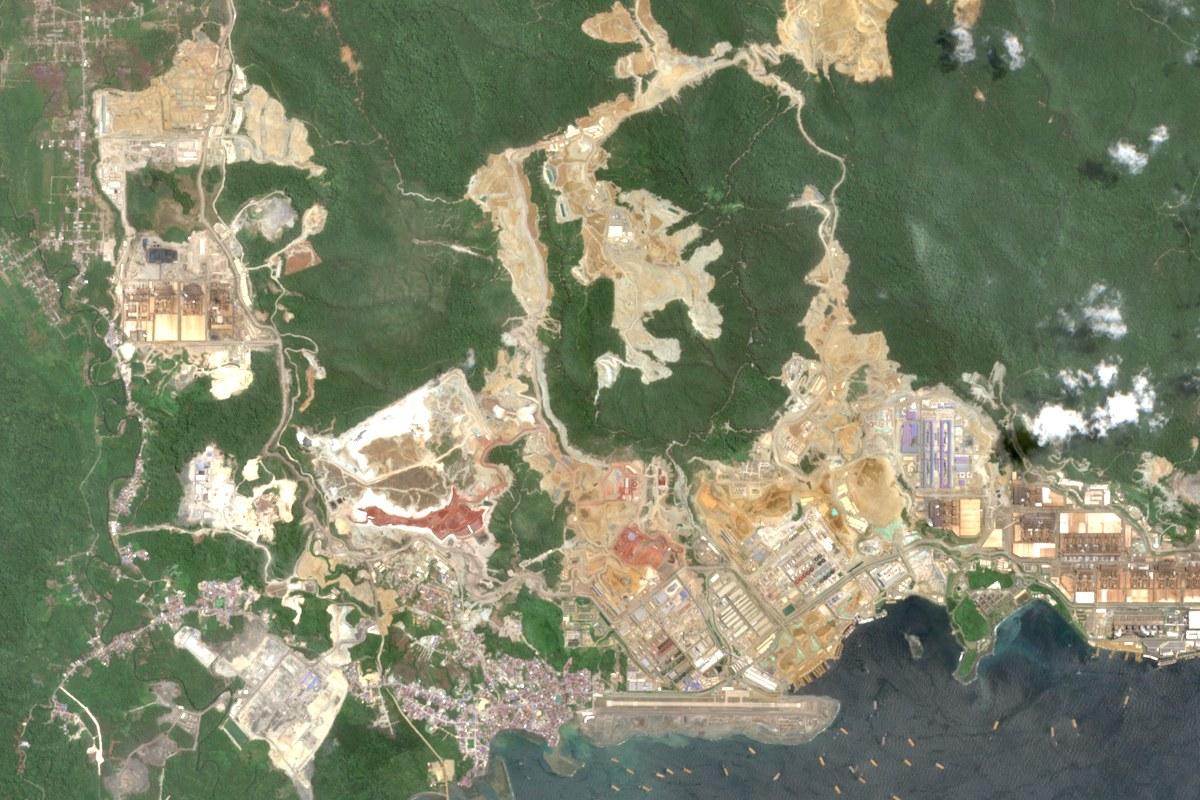
This is Weda Bay, on the Indonesian island of Halmahera, in October 2021. It is a nickel mining and processing area, and nickel from places like this goes into batteries. In the picture there are forested hills above the coast, an industrial plant on the shore, and a few narrow tracks running inland.
We have measured forest loss here every six months since then. The first figure was 54 hectares. It climbed to 259 hectares by April 2023 and then fell back. For three half-years in a row it stayed between 117 and 146 hectares, and it looked as though the rush was over.
Then it rose to 404 hectares in the six months to April 2026, and to 654 hectares in the six months to October 2026. That is the highest half-year we have on record, and more than four times the 146 hectares of a year earlier.
The second picture shows where it went. Land in the north-west that was forest in 2021 was bare by 2023, and by August 2026 it carried large roofed buildings and yards. Inland, the cleared strips along the ridges are wider and longer than they were. The clearing is still moving into the hills.
If nickel from this area is in your products, the forest loss linked to it is now more than four times what it was a year ago.
The same pattern, on a smaller scale, in Sarawak
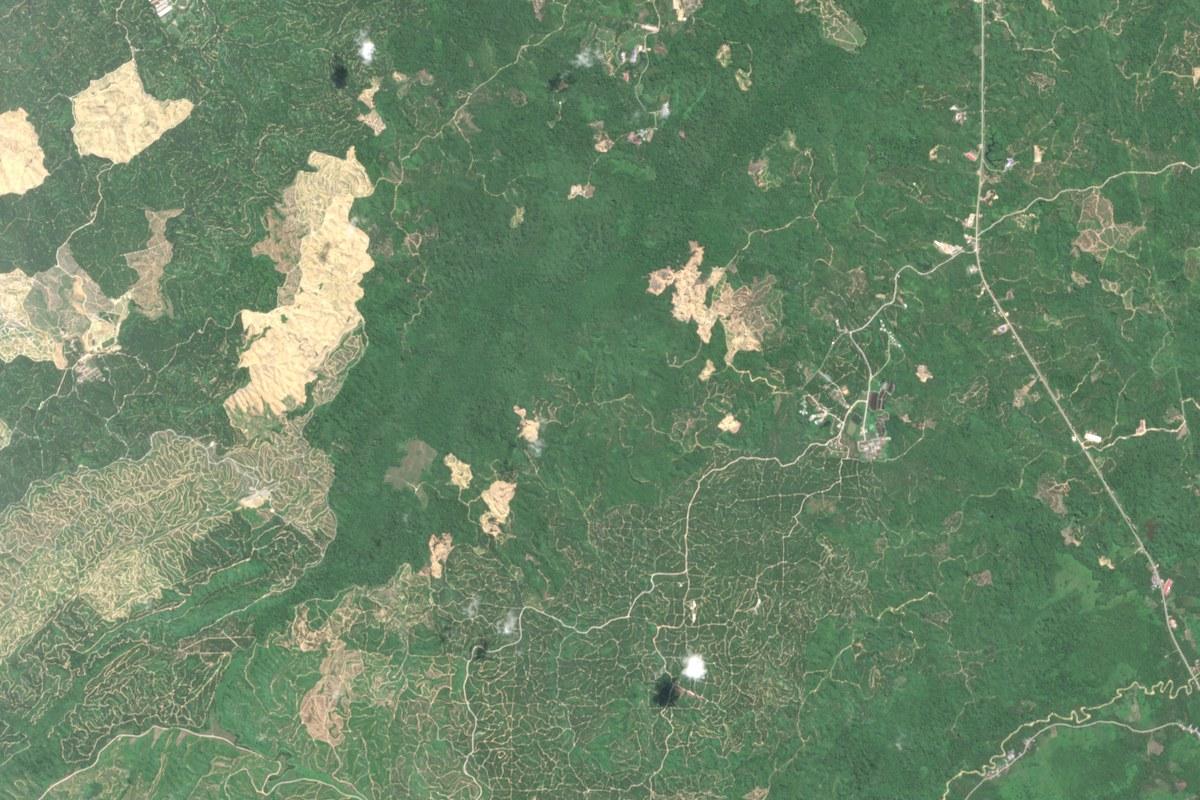
Further west, in a palm oil area in Sarawak, Malaysia, the numbers are smaller and the pattern is the same. Clearing had fallen as low as 10 hectares in a half-year, and stayed between 15 and 28 hectares for four periods in a row. In the six months to October 2026 it jumped to 86 hectares, about three times the half-year before.
In the picture there are fresh clearings in the west, the middle and the north-west of the area. All of that ground was forest in July 2024. Because it is happening in more than one place, one supplier's answer will not cover it.
There is a second reason not to wait. Ground that was cleared here between 2021 and 2024 had already been terraced into planting rows by June 2026. Within about two years cleared land becomes a plantation, and by then the clearing itself is hard to see.
Under the EU deforestation rules any clearing after 31 December 2020 counts, however small. Palm oil grown on that newly cleared land cannot be sold in the EU as deforestation-free.
Eleven months
Now put that beside the yearly questionnaire.
Suppose your audit is every September. The jump at Weda Bay to 404 hectares was visible five months before your September 2026 audit. The 654 hectare figure arrived a month after that audit closed, so on the yearly calendar you would first hear of it in September 2027. That is eleven months in which you could have asked a question and did not know to.
What the picture cannot tell you
We want to be exact about the limits. The record shows that forest was disturbed. It cannot show who did it, or why, or whether your own material comes from that ground. Sarawak in particular is an area with several growers, and we do not point at any of them. Those are questions for your suppliers. The figures tell you when to ask.
The figures, half-year by half-year
| Six months to | Weda Bay nickel area (hectares) | Sarawak palm oil area (hectares) |
|---|---|---|
| October 2021 | 54 | 163 |
| April 2022 | 115 | 39 |
| October 2022 | 149 | 52 |
| April 2023 | 259 | 47 |
| October 2023 | 205 | 33 |
| April 2024 | 93 | 10 |
| October 2024 | 117 | 25 |
| April 2025 | 120 | 15 |
| October 2025 | 146 | 21 |
| April 2026 | 404 | 28 |
| October 2026 | 654 | 86 |
The next figures will run to April 2027. At Weda Bay, a fall back towards 150 hectares would tell us the surge has passed, and another figure above 400 would tell us this is the new pace. In Sarawak, a second figure near 86 hectares would mean clearing has picked up for good.
Both areas are in our free Outlook tool for sustainability teams. You can set the month of your own audit and see what was already visible by then. To look at a sourcing area of your own, you can ask us to check a site.
Related analysis
More from RondoTrace.

The same methodology, applied to a site you choose.
Forensic retrospective on any supplier site — including yours. We deliver the methodology, the imagery, the dated observations, and the limitations. Thirty days, no commitment.